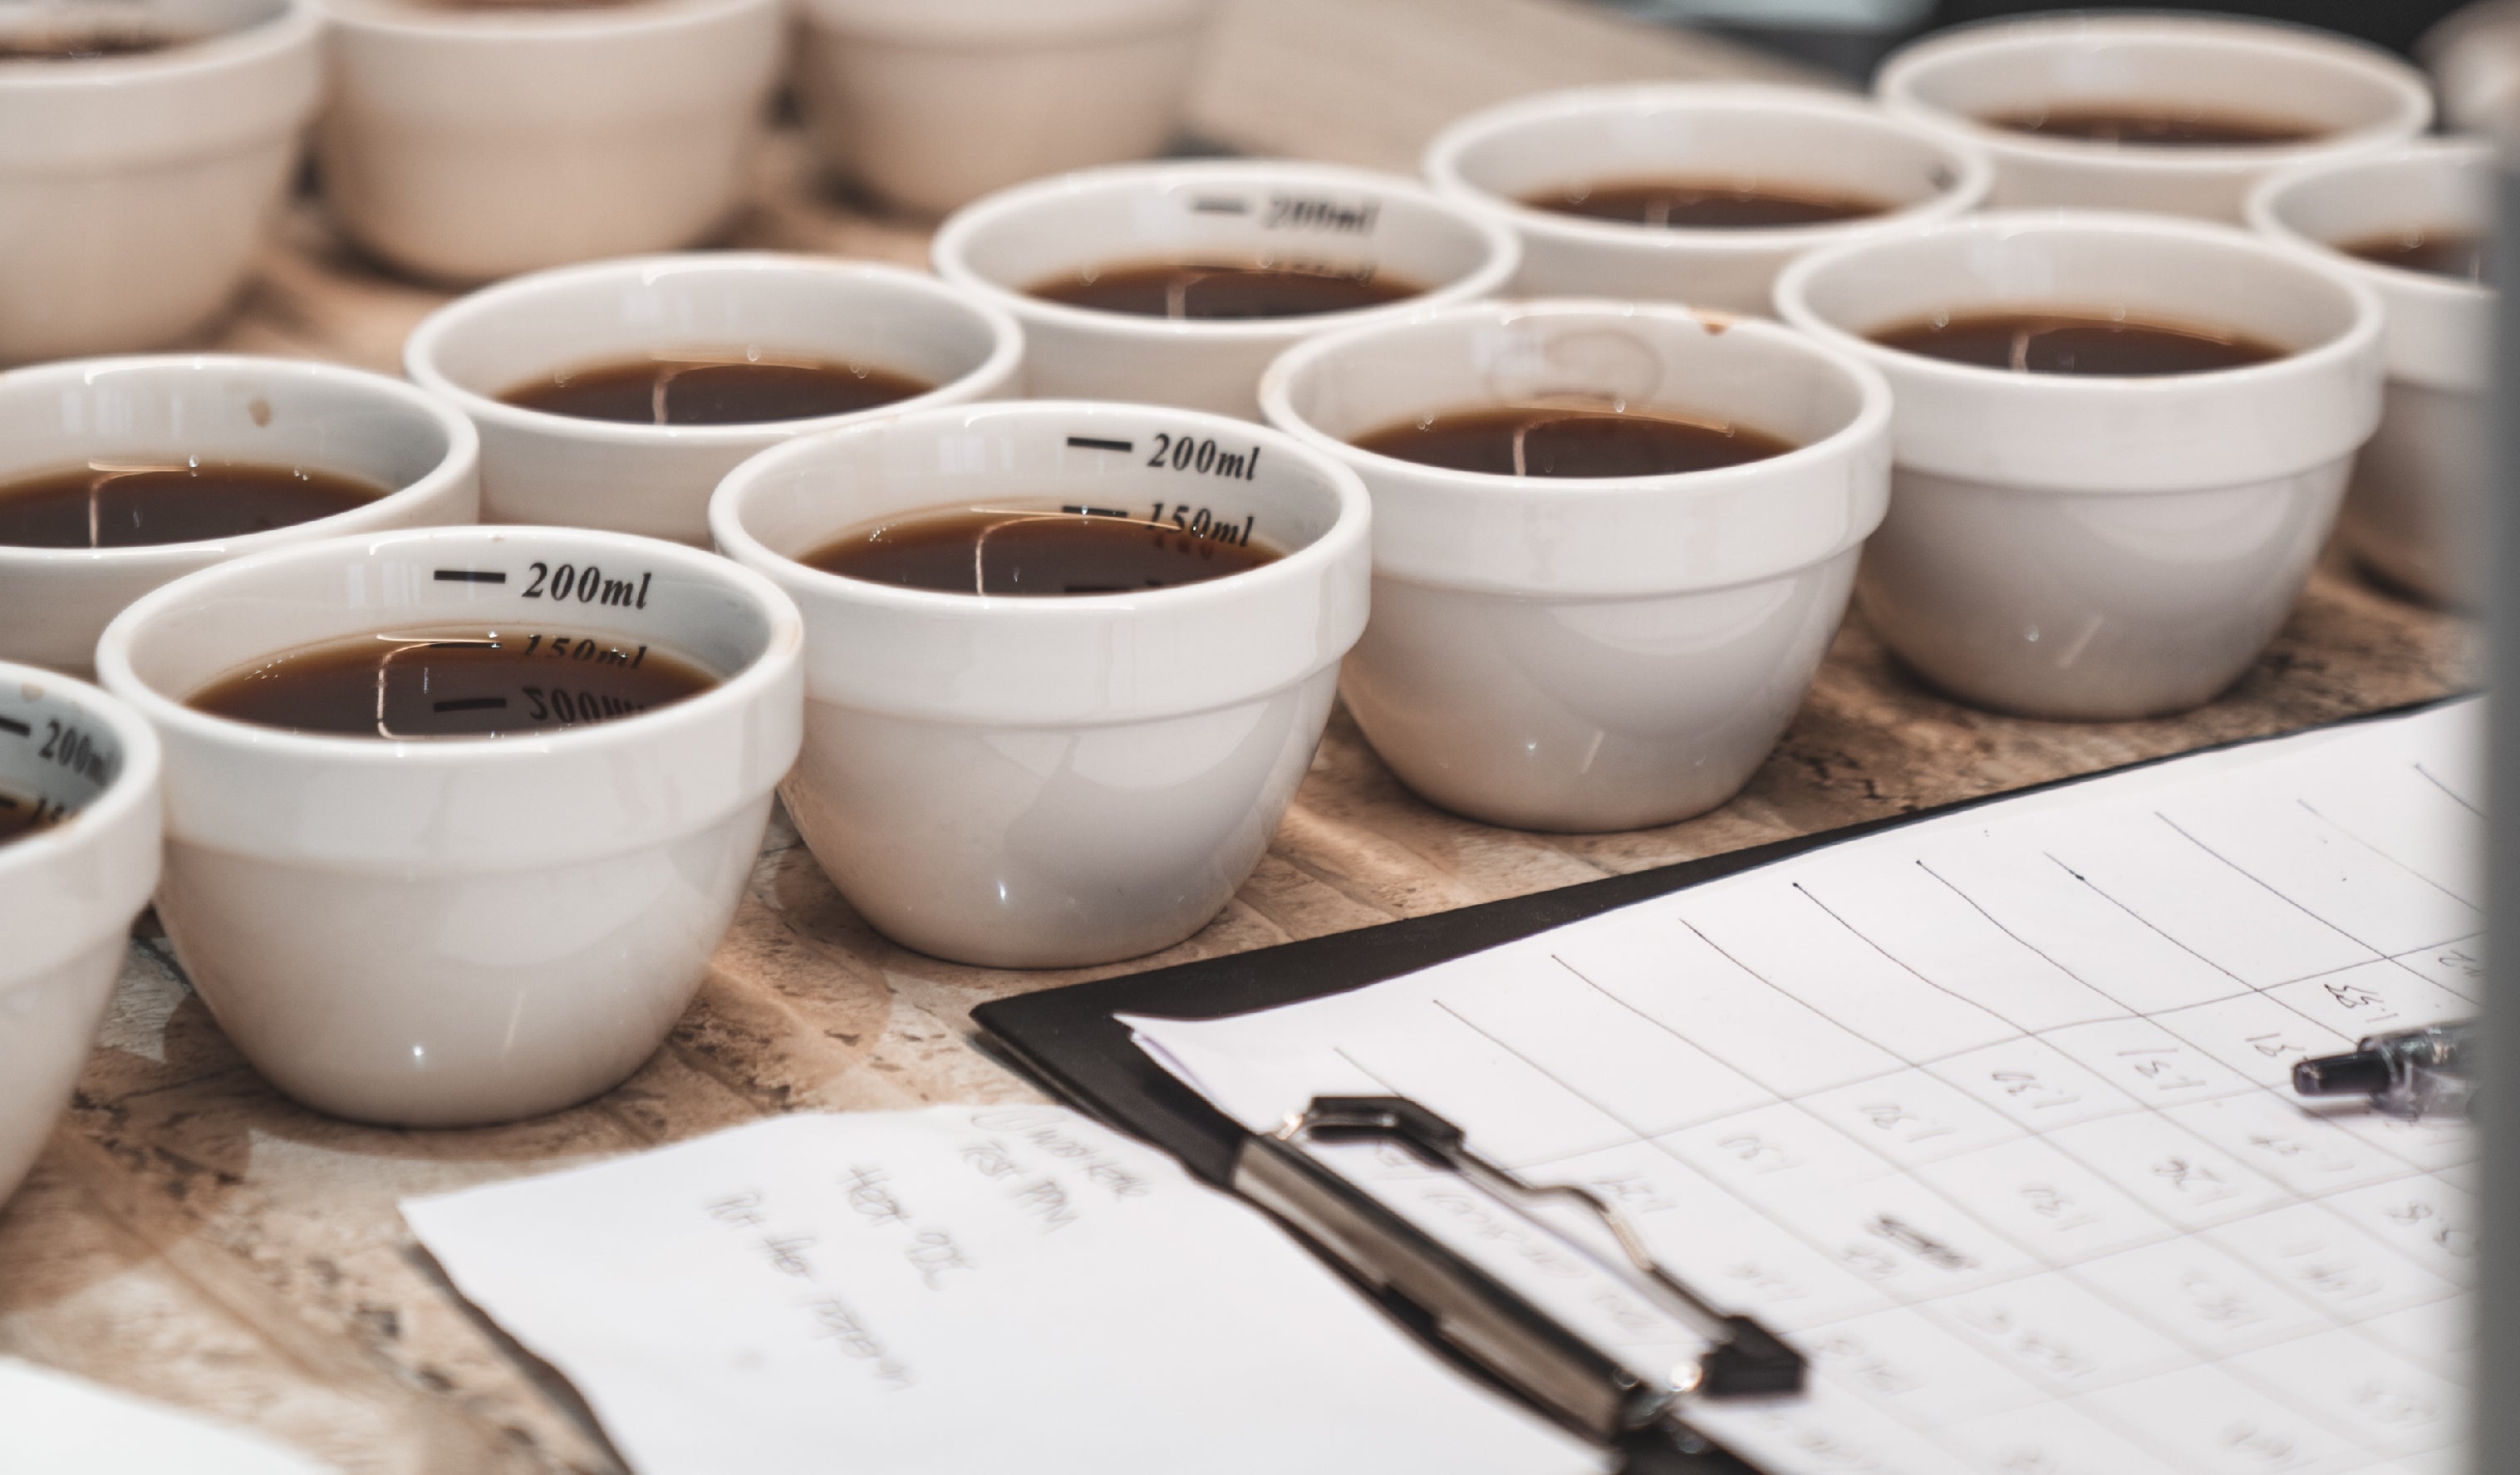
Exploration On Water
Our first attempt at a mini experiment series to explore coffee concepts and break them down into bite-sized information for home brewing looks at the first ingredient in brewing any cup of coffee: the water that we use!It is known that water is an important factor in brewing. When brewing at home, the two common options for those who have invested in a water preparation setup are often either standalone water filters like Peak Water or Brita, or do-it-yourself (DIY) water products such as Aquacode or Barista Hustle water recipes. DIY water products are often more complex in preparation, and results can vary according to the attributes of the water that is prepared.This mini experiment aims to shed light on deciding the target hardness for these DIY water recipes, or simply, the ratio of minerals (in the form of concentrated solution, or salts) to distilled water to be mixed in coffee brewing water.Given how this can be controlled by each individual, can the performance of the final cup of coffee be affected by the hardness of the water that was used? To come up with an answer, it is important to first understand how exactly the hardness of water affects extraction of coffee compounds. These form the premise for our mini experiment today. Coffee brewing is an ever complex subject, and subtle variances in brewing may skew results. To balance the inconsistencies that may come with quick flowing percolation extraction, we elected to use the Hario Switch dripper as our brew equipment. The experiment approach takes inspiration from the industry practice of cupping, and utilizes filtered immersion brewing as the basis on which results are obtained.
Hypothesis
The objective of this experiment is to evaluate how the general hardness of DIY brewing water will affect the amount of soluble compounds extracted from the coffee grounds
Independent variable
The general hardness of the water used for coffee brewing, ranging from 30-130 parts-per-million (ppm).
| General Water Hardness (ppm) | 30 | 50 | 70 | 90 | 110 | 130 |
|---|---|---|---|---|---|---|
| Number of trials | 3 | 3 | 3 | 3 | 3 | 3 |
Dependent variable
The amount of soluble compounds extracted from the coffee, measured in Total Dissolved Solids (TDS) and Extraction Yield percentage (EY%).TDS is a measure of the dissolved inorganic and organic substances present in a liquid, while EY% is a measure of the solubles dissolved during the brewing process, expressed as a percentage of the coffee’s mass. It is represented by the Extraction Yield percentage (EY%) of an immersion brew coffee, calculated using the formula referenced from Coffee ad Astra:
Constants
By making sure that each brew is consistent and reproducible, the constants allow for a fair comparison of the results of the experiment.
Brewing method and variables
Brewing method is fixed at a 4-minute immersion time before releasing the brewed coffee, with the use of a Hario Switch with Sibarist filter papers and 96°C water.
Coffee beans
The coffee being used is Morea from the roastery, taken from the same batch of roasted coffee. Each brew uses a 15g dose of coffee at a medium-fine grind size.
Type of water
All coffees were brewed with water mixtures that have been made with a combination of Aquacode and Life Pure Distilled Drinking Water.
Consistency of measurement
Measurements are taken at consistent intervals: Mass of Brewing Water is recorded immediately when the addition of water is completed, and TDS is taken as the average of measurements 8-10 minutes after commencing the brew.
Results
There is an increasing trend of average total dissolved solids (TDS) measured as the general hardness of water used increases from 30ppm to 130ppm. The corresponding Extraction Yield percentage (EY%) that is derived also reflects the same relationship.
The TDS of all the coffees brewed in this mini experiment has a sample mean of 1.6 with a sample variance of 0.0005, while the EY% has a sample mean of 24.48% with a sample variance of 0.0011%.We can observe that there is potentially a positive correlation between both TDS and EY% with the general water hardness used in brewing coffee. However, due to the limited sample size used, this observed correlation is not conclusive of a statistically significant relationship. In conducting these tests, we also acknowledge that there are also some limitations in this mini experiment that are worth exploring in future experiments:
1. Brew time
With each brew, the time taken for the brew to completely drain through varies slightly. The fluctuation in results at the individual ppm levels suggest that for immersion, EY% is closely related to the immersion time of the brew more so than the rate of extraction at varying general hardness of the water. To further understand the impact of general water hardness on the rate of extraction, experiments utilizing fast flowing percolation drippers with the continual addition of fresh water could help to further identify the relationship between these two variables.
2. Aquacode
The exclusive use of Aquacode allows us to ensure consistency in the mineral composition of water at varying PPM levels. However, in home use, water sources often vary in terms of mineral composition, which may in turn affect the rate of extraction.We expect that this result will be diminished in long duration immersion brews such as those in this experiment, where the rate of extraction may potentially be more aligned. However, it would be ideal for more experiments to be done using a variety of water sources to determine the relationship between mineral composition and extraction.
Interpretation
It is observed that as the general hardness of water used increases, the TDS of the coffee extracted and the EY% both increase. However, the differences in the levels extracted are marginal at best, which could be partly due to the choice of an immersion brewing method for this experiment.
Should home brewers wish to keep all other brew variables consistent, this mini experiment suggests that it is indeed possible to manage the rate of extraction of coffees by purely adjusting the general hardness of the DIY water. However, when relating it back to the performance of a coffee in terms of the taste and overall profile, it was very apparent from the experiment that the performance of each of these brews on the cupping table varies widely. Upon cupping each experimental trial, we noticed significant differences in tastes, summarized in the table below:
Summary of cupping commentaries
| PPM | Comments | Rank |
|---|---|---|
| 30 | Clean, high flavor clarity but with flat acidity | 3 |
| 50 | Lighter flavors and an astringent acidity | 4 |
| 70 | Balanced, with clear sweet profile | 1 |
| 90 | Balanced, with a slightly pronounced acidity and body | 2 |
| 110 | Intense, harsh with a bitter finish. | 5 |
| 130 | Strong, harsh and heavy bodied. | 6 |
The consensus was that the coffees that performed best at the cupping table were those with a general water hardness of 70ppm and 90ppm – they were well balanced and had a more complete flavor profile compared to the rest.
Conclusion
The extraction rate of the coffee seems to be affected by varying the water hardness of DIY water used for brewing coffee. At the same time, there is a wide gap in performance of the coffee in flavours when brewed using the same methods with different water hardness.
This gap in taste profile has a more prominent effect on the performance in the final cup of coffee, compared to the TDS and EY% of the coffee brewed. At the small sample variance observed in TDS and EY%, any differences are likely to be too small to be identified by the taste palate alone. More importantly, the variation of water hardness plays a significant part in altering the taste profile in the final cup, rather than simply just a significant straightforward correlation with the amount of coffee extracted.For home brewers who are just beginning to dip their toes into making DIY coffee brewing water at home, it would be worth considering mixing water with general hardness of between 70-90ppm to allow for a comparatively more balanced profile, and altering other brew variables to achieve the desired extraction instead.
Journal Archive
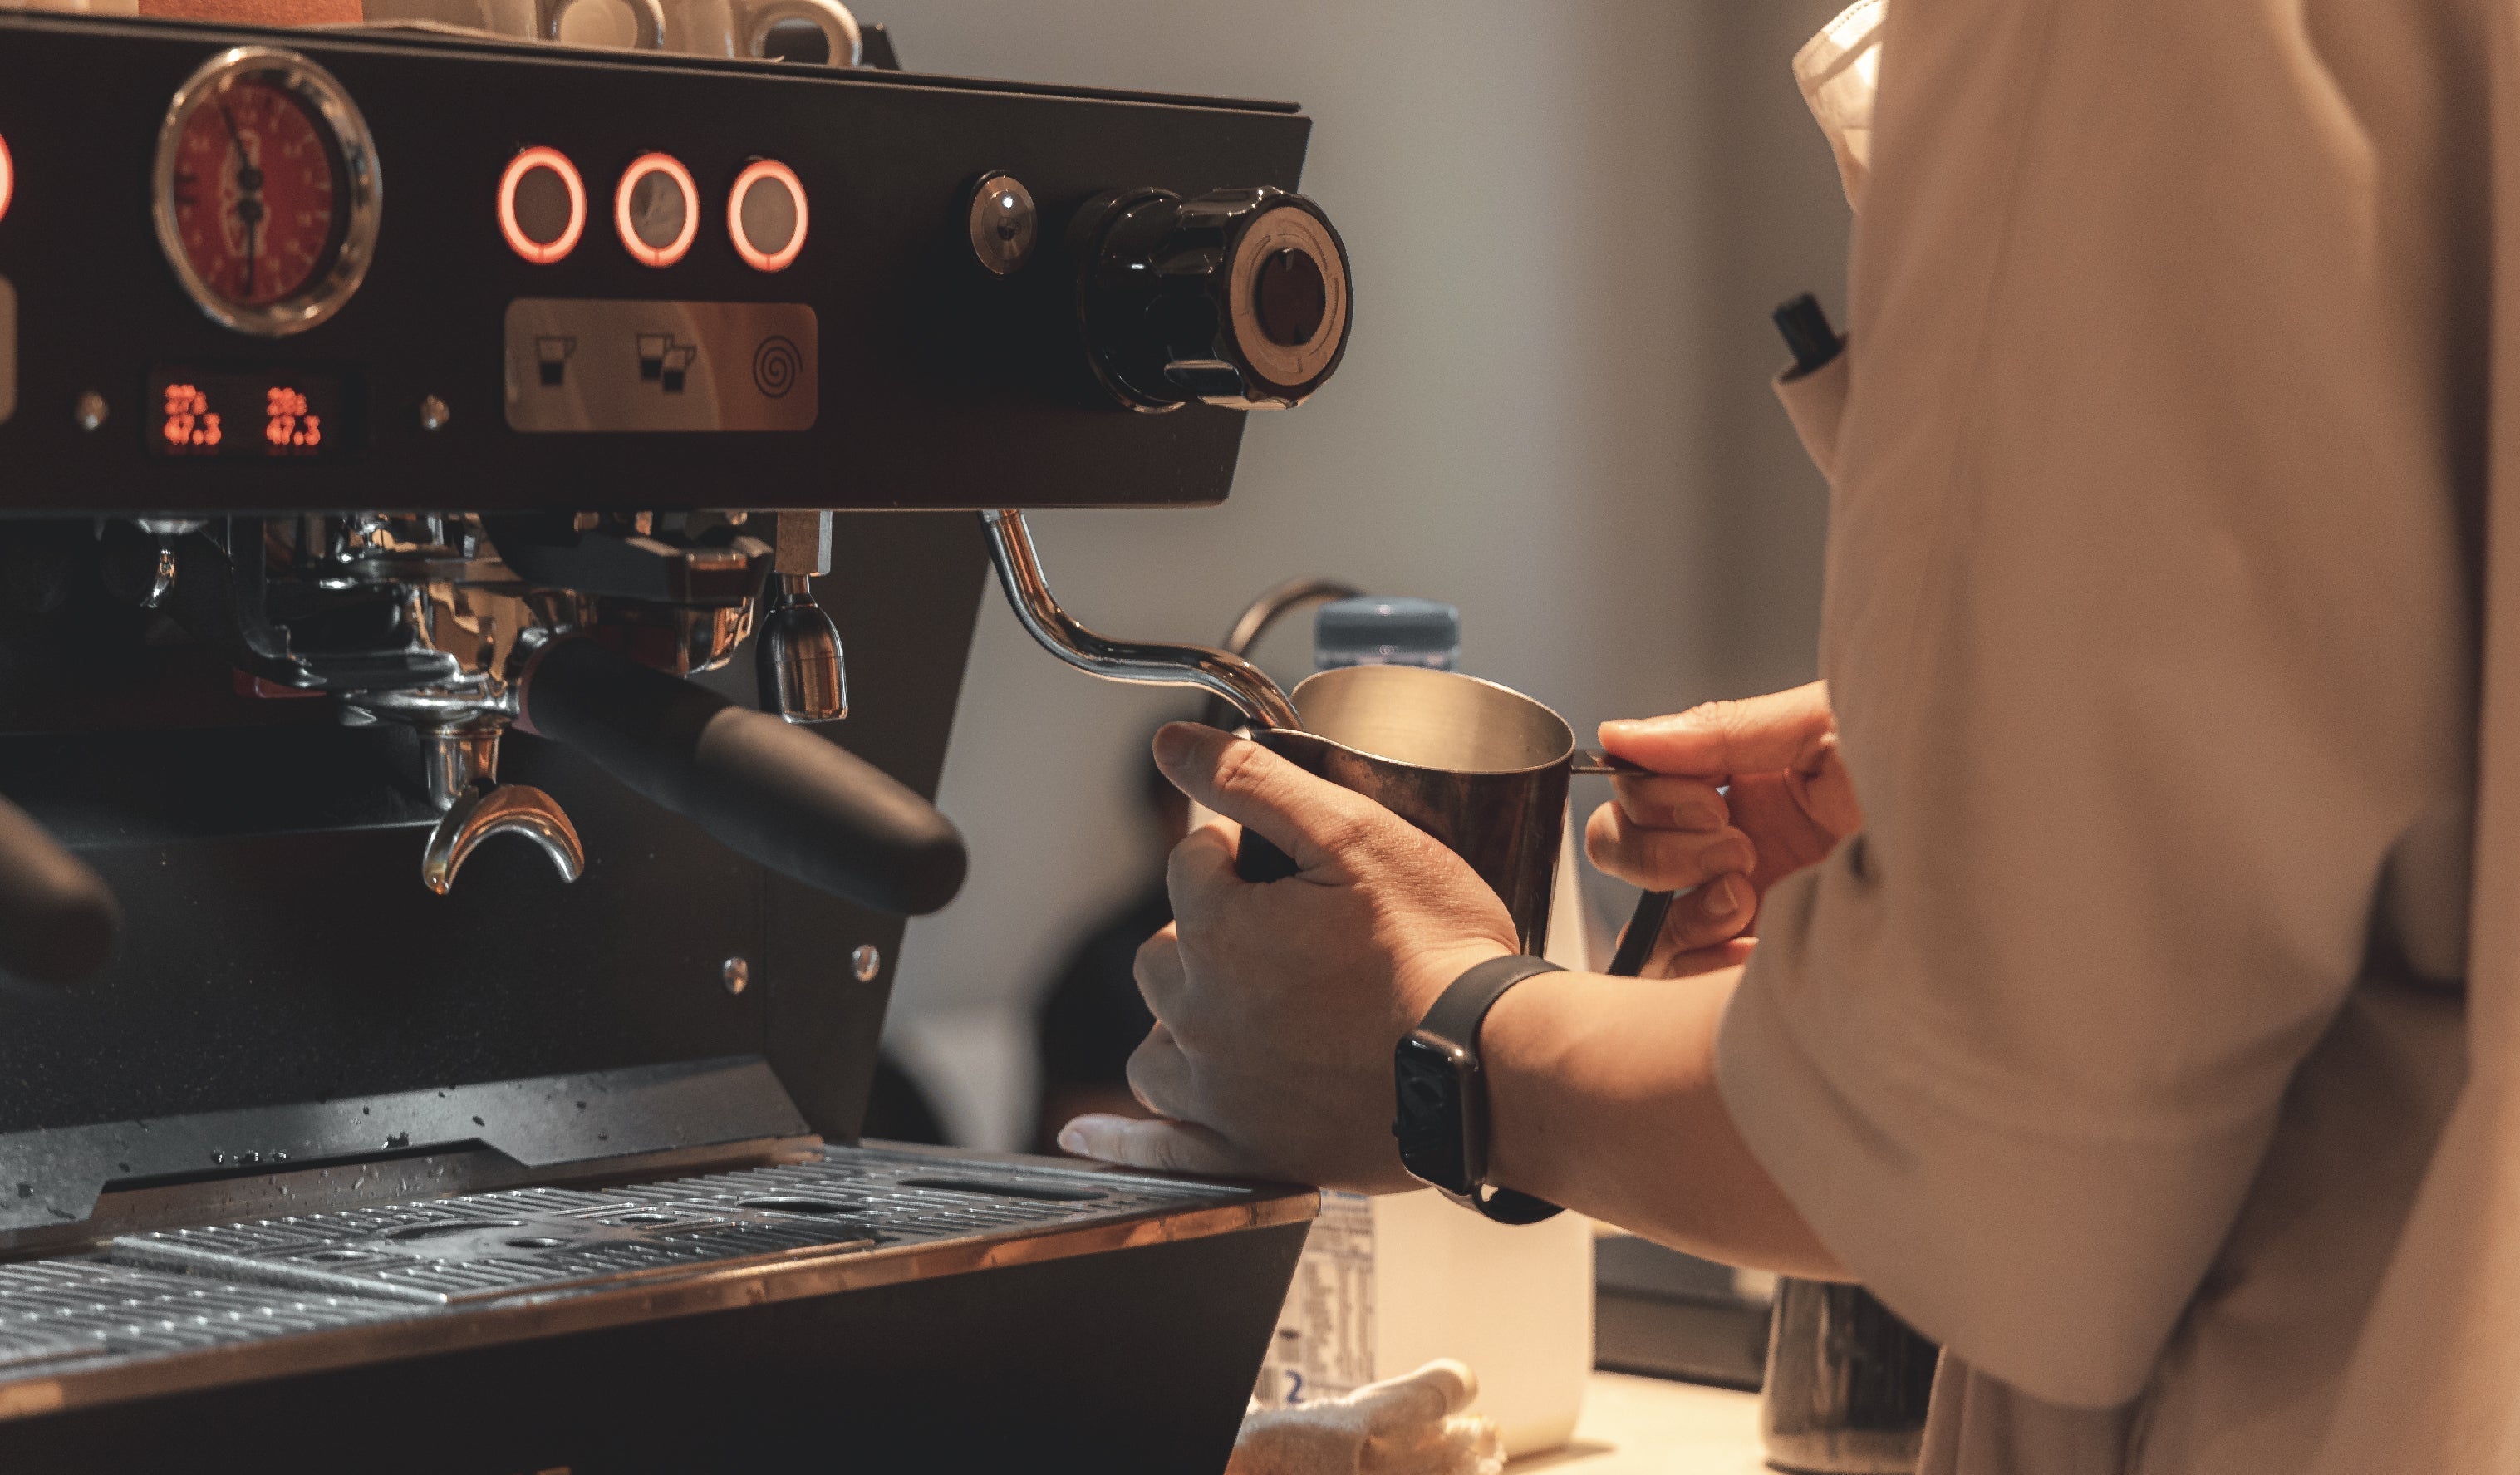
Milk in World Barista Competitions
An overview of milk concentration methods in coffee competition, focusing on freezing techniques that enhance milk's qualities for great coffee beverages.
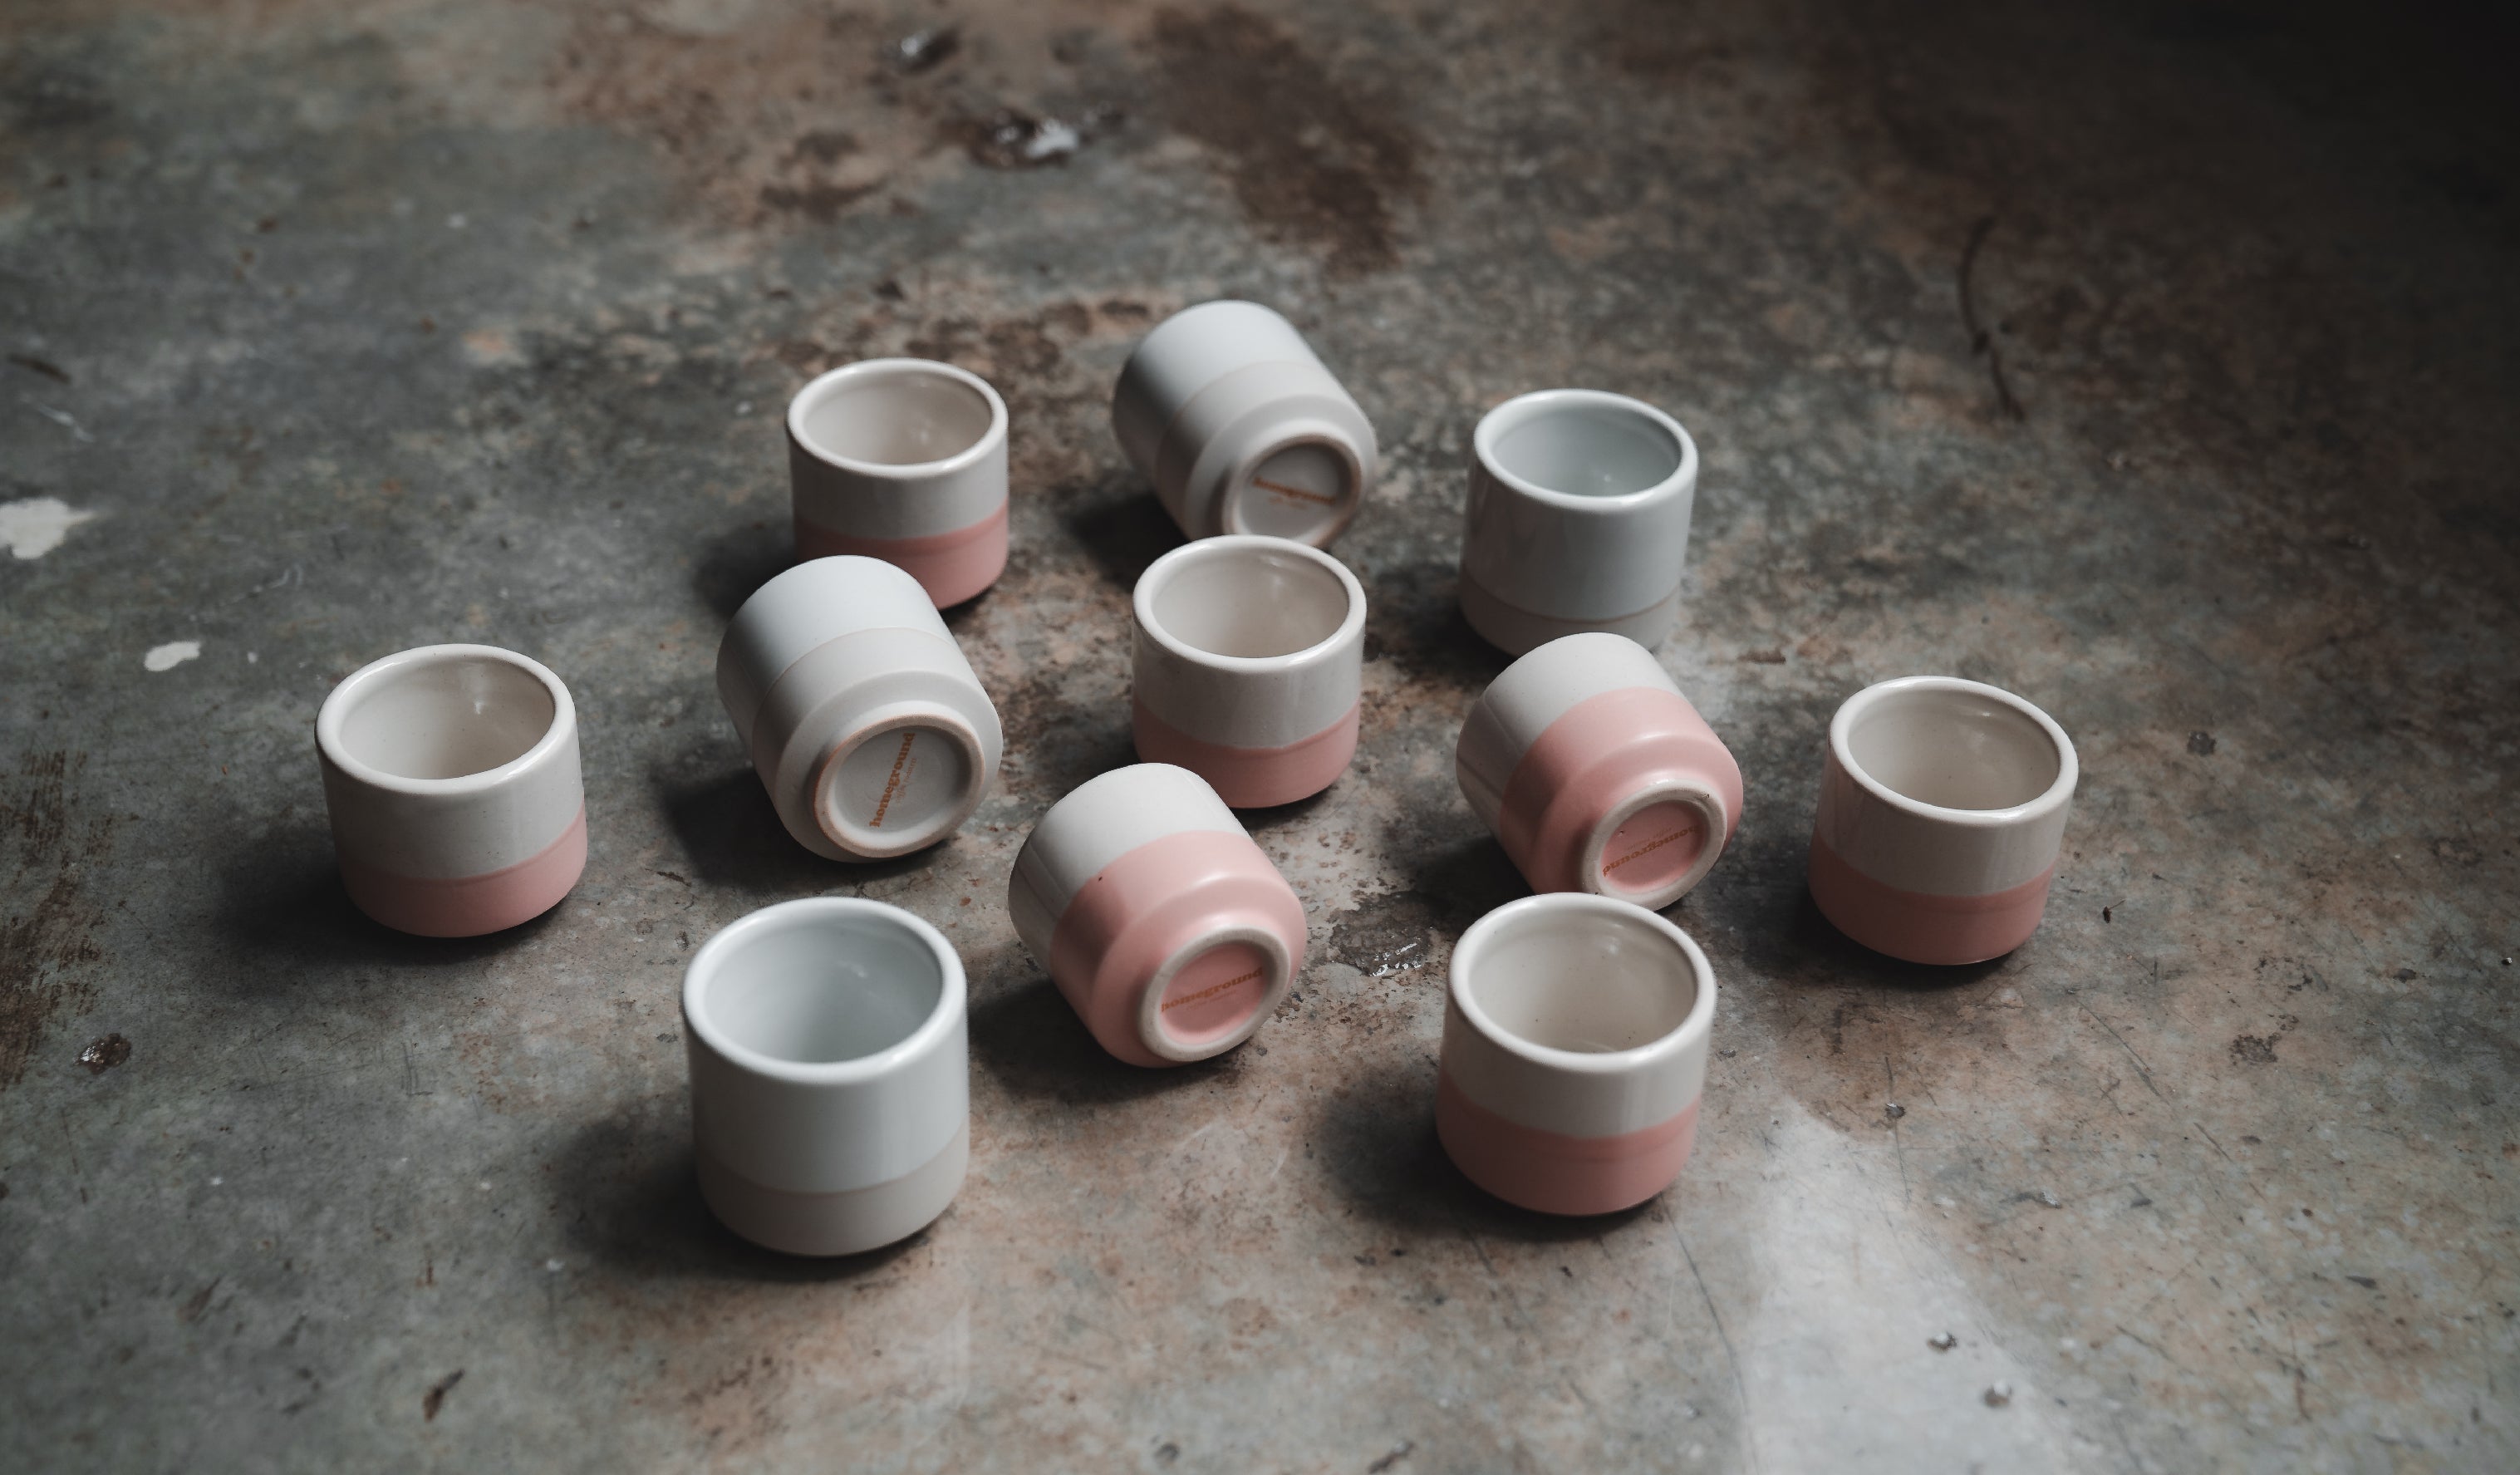
How Coffee Cup Colours Affect Your Drinking Experience
Cross-modal perception of colours on the taste of coffee
Learning to enjoy more
Same Coffees Everywhere, All at Once
Why do local specialty coffee shops serve the same coffees?
A study of unexpected coffee production nations
A low down on using puck screens for espresso machines


